Call the display Proportions: THE PICTURE OF PAOLA AND HER DOG.
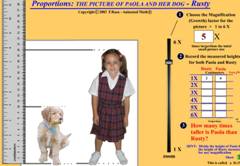 This display presents the concepts of proportion and ratio, being used to do indirect measurement, with one quantity and its relative, constant comparative size is used to determine another. A stretchable picture of a little girl and her smaller dog is used to illustrate the concept of proportions. As the picture increases or decreases in size, both images increase or decrease proportionally, so as to maintain the same relative size, or ratio between their heights.
A proportion is an expression of the relative size of two related quantities, as they increase or reduce together. If two quantities measure say, 2 and 6, and they grow or shrink in direct proportion, then they maintain a proportion of 2 to 6. In this case, the larger one will always be three times larger than the smaller. In this case, if the small number grows to double its size (2x2), to 4, the second one will also double (2x6) , to become 12. Likewise, if the first one grows to triple its size (3x2), or 6, the second will also triple its size (3x6) , or 18, etc. A proportion is therefore a multiplicative comparison.
A ratio is a special proportion, as it refers to each unit amount of one of the quantities, and describes the corresponding amount of change for the other. If two quantities maintain a proportion of say, 5 to 10, the proportion is 5 to 10, and the ratio is 1 to 2, or two units (10), for every unit of the other (5). A decimal representation of the proportion can also be obtained and be used as a multiplier, by dividing 10 by 5, yielding 2.0.
The number of units of one quantity can therefore be determined indirectly, if we know the number of units of the other. In our example, if the first quantity is measured to be 20 units, then the second quantity can be calculated by computing two for every one, 2.0 x 20, or 40 of the other.
HANDS ON: Interactive screen/wired/wireless-mouse or touch-sensitive
1.- In the Paola and her Dog display, use the left-side slider to change the size of the whole picture from 1X (times), to 2X, 3X, 4X, 5X, and 6X, etc. and recognize the number as magnification, or zoom factor. Explain how you feel about the relative sizes of Paola and her dog as youo increase their size in the display.
2.- Adjust/set the magnification factor for the picture to 2X, and fill in the corresponding sizes for Rusty and Paola in the table ( 8, 4 ). Compute the result of comparing the two values ( 8/4 = 2 ) and enter the corresponding entry in the RATIO column.
3.- Adjust the magnification factor for the picture to 3X, and fill in the corresponding sizes for Rusty and Paola in the table ( 12, 6 ). Compute the result of comparing the two values and enter it in the corresponding entry in the RATIO column.
4.- Adjust the magnification factor for the picture to 4X, and fill in the corresponding sizes for Rusty and Paola in the table ( 16, 8 ) . Compute the result of comparing the two values and enter it in the corresponding entry in the RATIO column.
5.- Adjust the magnification factor for the picture to 5X, and fill in the corresponding sizes for Rusty and Paola in the table ( 20, 10 ). Compute the result of comparing the two values and enter it in the corresponding entry in the RATIO column.
6.- Adjust the magnification factor for the picture to 6X, and to fill in the corresponding sizes for Rusty and Paola in the table ( 24, 12 ). Compute the result of comparing the two values and enter it in the corresponding entry in the RATIO column
7.- Press the green “Show” button, to check the entered RATIO values. If there are any incorrect values (different than 2), the display will change the "=" connector to a “< ?”. Why?
8.- Determine and correct each incorrect value . When all done, notice that REGARDLESS OF THE OVERALL SIZE OF THE PICTURE, THE RELATIVE/COMPARATIVE SIZE OF THE OBJECTS WITHIN IT REMAINS THE SAME, i.e. THEIR SIZES ARE “PROPORTIONAL”.
9.- In closing: How many times (ratio) taller is Paola than Rusty? (2) If both Paola and her dog keep growing PROPORTIONALLY, and Paola’s real-life height today is 120 centimeters, how tall would the real-life Rusty be? _________________ ( 60 centimeters ).
Call the HOW MANY SPOONS OF CHOCOLATE SYRUP? display.
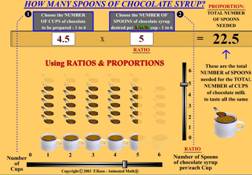 This display presents another example of the concept of indirect measurement: by using a known value of a ratio between two quantities, and the value of one of the two quantities, to evaluate the other. In the display, both the number of spoons of chocolate syrup per cup (ratio) and the total number of cups required can be set. When both these are set, then the total number of spoons of chocolate syrup required is calculated.
HANDS ON: Wide-screen/Wireless-mouse or Touch-Screen
1.- Exercise the two slider bars, and show the effect of moving them. Point out the advantage of the “virtual” nature of the display, as we mix instant chocolate drinks, and “half-cups” without spilling (!).
2.- Select ONE cup, and see how it can have up to 6 spoons of chocolate syrup. Choose then 2, 3, 4, 5, and 6 spoons, and observe the multiplicative effect as we choose to prepare more cups (2, 3, 4, …) of chocolate.
2.- Evaluate and fill the missing values in the table below (show a printable worksheet page):
Total # of cups desired |
Ratio
# spoons per cup (chocolate flavor) |
Total # spoons of syrup needed |
2 |
0.5 |
(1) |
4 |
0.5 |
(2) |
6 |
0.5 |
(3) |
(4) |
3.0 |
12 |
5 |
(2.0) |
10 |
3 |
3.0 |
(9) |
(4) |
3.5 |
14 |
4 |
(3.0) |
12 |
6 |
(1.5) |
9 |
Ratios and proportions in geometry maps
Maps are relatively small drawings that represent large regions of our world.
Maps show details of an area of region in scale, so we can have an idea of the form, how large or how far places are around us. To show distances faithfully, maps use what is called "a scale", or a fixed relative size of the distance within the small map, to the actual corresponding distances in the real world region.
Call the "Measuring Distances on a Satellite Map" display.
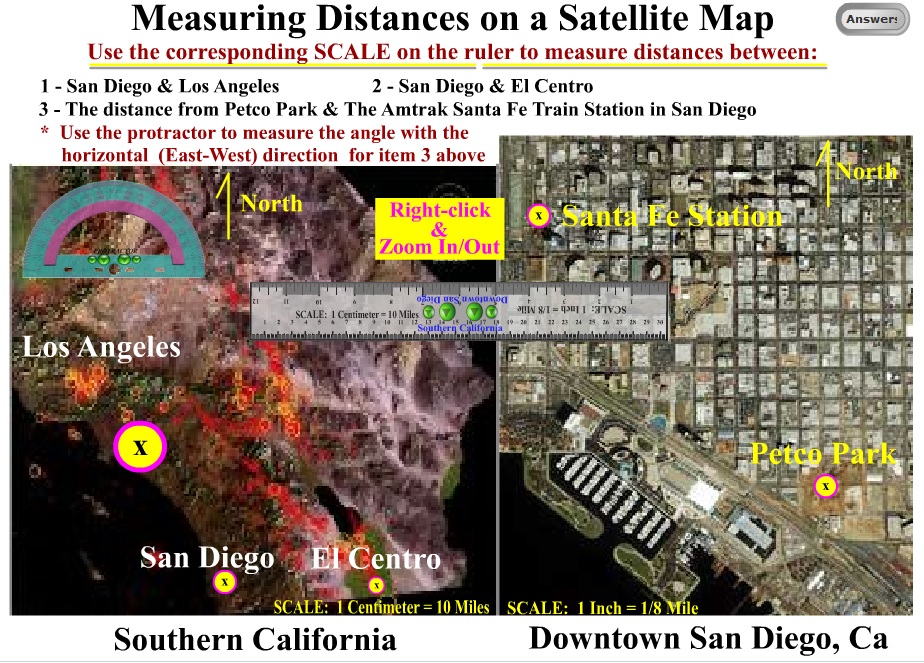 Observe that the display includes the images of two maps of Southern California regions, one of the San Diego-Los Angeles area, and another of downtown San Diego. Both maps include markings (yellow spots) indicating the location of special points of interest. The display also includes a ruler, which can be used to measure distances on the maps, and statements of the scale used on each to represent the actual distances in the real world.
HANDS ON: Interactive screen/wired/wireless-mouse or touch-sensitive
1.- Follow the instructions included on top of the display, zooming-in the images as necessary, to measure the distances on the maps with the ruler. Then, using the scales stated and the corresponding proportions, calculate (indirect measure) the actual distances between the real points in Southern California cited in the maps.
3.- Push/hold the active button "Answers" on the top right corner to check your measurements.
Measuring triangles
Call the TRIGONOMETRY display.
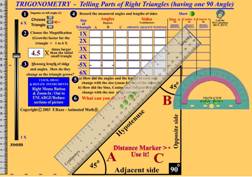 Trigonometry is about being able to indirectly determine side and angle information in a "right" triangle (one that has one of its 3 internal angles measuring 90 degrees) , based on available information on other sides and angles. In everyday life, this is an extraordinary ability that allows us to make and do more things, easier, more economically and safer.
This display contains elements to measure, compare and determine the sides and angles of three commonly referenced (angle "A") right triangles, 30, 45, and 60 degrees.
HANDS ON: Wide-screen/Wireless-mouse or Touch-Screen
NOTE: THIS ACTIVITY MIGHT BE BROKEN DOWN IN SEVERAL SESSIONS, AS NEEDED.
1.- Explore each of the elements of the display: a) The ruler, b) the triangle, “Choose triangle” buttons, zoom-slider-bar, and the “Adjacent”, “Opposite”, and “Hypotenuse” named sides of the triangle, c) the protractor, d) the entry table, and its auxiliary “Show”, and “Calculator” buttons.
Notice the shape and the value of the three internal angles for the 30, 45, and 60 degree angles included in the display. Use the left side slider to observe changing dimensions.
2.- Observe step (1) in the display, and have select the 30 degree triangle from the “Choose triangle” buttons. Exercise the “zoom – Size of triangle” slide bar with it.
Question: Does it look like the sides of the triangles remain “proportional”, relative to each others (i.e. maintain the same shape/form), as the triangles grow or shrink in size? What about the three angles?
SIDES
Focus on step (2) and place the zoom bar at 2X. Have the student drag the ruler over the triangle, and rotate it so as to measure (step 3) the length of the Hypotenuse in centimeters ( 16 ), drag and rotate the ruler to measure the length of the Opposite side ( 8 ), and the length of the Adjacent side ( about 14 ).
NOTE: Use of the “Zoom in” (Shift-Pull-down-Menu) feature to obtain a more accurate measurement of the Adjacent side ( 13.9 ). When done, enter the readings for the length of the 3 sides in the corresponding boxes of the table (step 4) - (show a printable worksheet page).
NOTE: The measurement of the angles will be done in a later step.
3.- Now do similarly with a zoom factor of 4X. ( about 32, 16, and 28, or more accurately: 32.2, 15.9, 27.8 ) NOTE: The “Distance marker”, and zooming could be used to help extend the measurement of the Hypotenuse beyond the length of the ruler (30 centimeters). Record also the sizes in the corresponding 2X row and columns of the table.
Question: Does it look like the sizes are “2X” (double) larger each? What do you think will happen if we try 6X?
4.- Write a prediction for 6X, and then proceed to move the zoom slider, measure, and record corresponding numbers ( about 48, 24, and 42 ).
5.- Write the class predictions for 1X, and then proceed to move the zoom slider, measure, and record corresponding numbers ( about 8, 4, and 7 )
6.- Write predictions for 3X, and then proceed to move the zoom slider, measure, and record corresponding numbers ( about 24, 12, and 21 )
7.- Write predictions for 5X, and then proceed to move the zoom slider, measure, and record corresponding numbers ( about 40, 20, and 35 )
ANGLES
8.- What about angles, can you explain in words what they are? ( something like: measure of “sharpness of corners” ) How are they measured? (what are “degrees”? ).
NOTE: Use the “Where angle measurements came from” display, shown below, to identify how 360 degrees and quarters of a circle relate to a year, seasons and days in the common Julian and Gregorian Roman calendars.
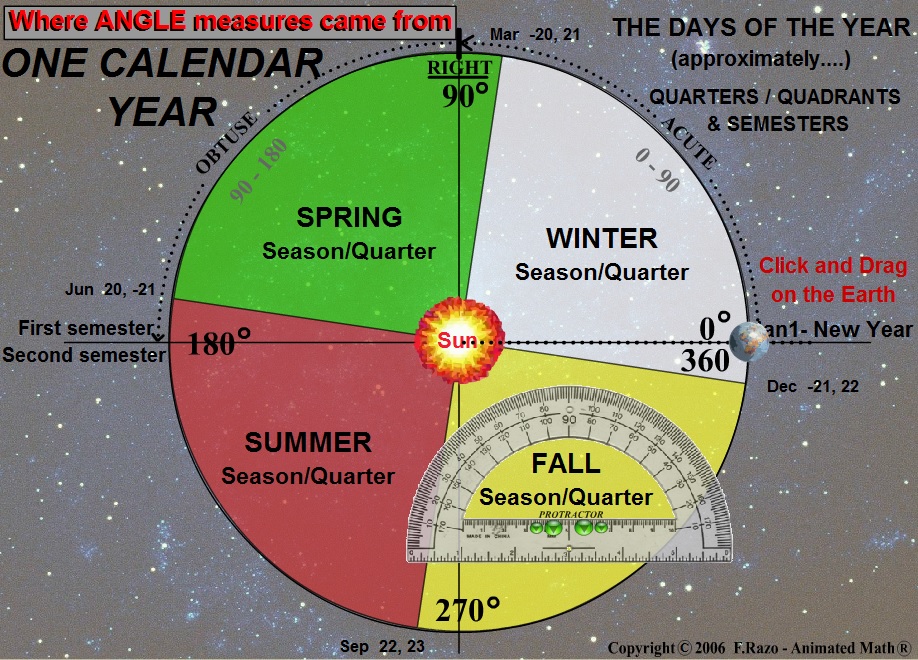
9.- Choose to “Show all” on the zoom menu, keep the “Choose triangle” selection to 30 degrees, and place the triangle zoom factor of 4X. Focus on the protractor, and zoom-in twice. Point out to the 360, 90, 60, 45, 10, 1, and 0 degree markers on the protractor, and the fact that it provides the same range in both “clockwise”, and “counter-clockwise” directions, for user convenience. Show also how it can rotate, to be able to measure corners in every direction.
Move the protractor to the 60 degree corner, and Zoom-out once. Drag the whole image so the 60 degree corner (angle B) is exactly in the center of the display, and move the center “eye” of he protractor to be exactly in the center of the eye.
Rotate the protractor (approximately 9 gross-button clicks), so the window-line of the protractor and the Opposite side (vertical) of the triangle coincide (at 0 degrees). Zoom-in again to be able to read the angle measurement (60 degrees) more clearly.
Zoom to “Show all” when done, and enter the “60” value for angle B and zoom factor 4X row in the table.
10.- Do likewise and measure angle A of the triangle. When done, the student should zoom to show-all, and enter the corresponding value in the table.
11.- Do likewise and measure angle C of the triangle. When done, the student should zoom to show-all, and enter the corresponding value in the table.
12.- Slide the zoom factor from 1X, through 6X, and enter what the A, B, and C angle measurements should be ( the same for all triangle sizes ).
Fill in all the angle measurements for the rest of the table entries.
REVIEW OF SIDES AND ANGLES
Question: Does it look like the sides of the triangles remain “proportional” to each others (i.e. same shape), as the triangles grow/shrink in size? What about the angles?
“TRIGONOMETRIC FUNCTIONS”
13.- Focus on the last three columns of the table, headed “Sine A”, “Cosine A”, and “Tangent A”. Calculate the value of the indicated ratios: “Sine = OPPOSITE / HYPOTENUSE”, “Cosine = ADJACENT / HYPOTENUSE”, and “Tangent = OPPOSITE / ADJACENT”.
Call the (scientific) calculator on your computer to observe its trigonometric function calculations.
14.- Questions:
- Do you think the TRIGONOMETRIC FUNCTION (ratio) values would be the same or different, for triangles that are smaller, or larger?
- Calculate the SUM (addition) of the size (degrees) of the three interior angles for each and every triangle What is that value? Do you think the value of the sum will be the same, or different for different triangles?
- How do you think the trigonometric functions can be useful to people building things?
- There are 3 other “trigonometric functions” which are simply the inverse of the three primary ones:
Secant (the inverse of Sine) = 1 / Sine
Cosecant (the inverse of Cosine) = 1 / Cosine
Cotangent (the inverse of Tangent) = 1 / Tangent
Why do you think these “additional” functions are necessary?
How can they be helpful?
ACTIVITY #1 - GRADE LEVEL: 2nd - ADULT
Trigonometry - Measuring triangles
HANDS ON: Wide-screen/Wireless-mouse or Touch-Screen
Recall the TRIGONOMETRY display - for heavy practice.
 In the display, use the “Choose Triangle” button, and the “zoom – Size of Triangle” slider bar to produce triangles of each type (30, 45, 60 degrees), and size (1X, 2X, 3X, 4X, 5X, 6X), as indicated in the table below.
For each case, the ruler and the protractor will be used to measure the length of each of the sides (3), and each interior angle (3). These measurements, and the calculation of the (3) basic trigonometric functions (Sine, Cosine, Tangent) are to be recorded in corresponding tables - can be printed on paper pages from Trigonometry Worksheet.
When the table is completed, the “Show” button should be pressed, to verify the calculations, and correct any possible mistakes.
I – 30 degree triangle
Zoom Factor |
Angle
A |
Angle
B |
Angle C |
Side
opposite |
Side
adjacent |
Hypotenuse |
Sine |
Cosine |
Tangent |
Sum of angles |
1X |
|
|
|
|
|
|
|
|
|
|
2X |
|
|
|
|
|
|
|
|
|
|
3X |
|
|
|
|
|
|
|
|
|
|
4X |
|
|
|
|
|
|
|
|
|
|
5X |
|
|
|
|
|
|
|
|
|
|
6X |
|
|
|
|
|
|
|
|
|
|
100X |
|
|
|
|
|
|
|
|
|
|
II – 45 degree triangle
Zoom Factor |
Angle
A |
Angle
B |
Angle C |
Side
opposite |
Side
adjacent |
Hypotenuse |
Sine |
Cosine |
Tangent |
Sum of angles |
1X |
|
|
|
|
|
|
|
|
|
|
2X |
|
|
|
|
|
|
|
|
|
|
3X |
|
|
|
|
|
|
|
|
|
|
4X |
|
|
|
|
|
|
|
|
|
|
5X |
|
|
|
|
|
|
|
|
|
|
6X |
|
|
|
|
|
|
|
|
|
|
100X |
|
|
|
|
|
|
|
|
|
|
III – 60 degree triangle
Zoom Factor |
Angle
A |
Angle
B |
Angle C |
Side
opposite |
Side
adjacent |
Hypotenuse |
Sine |
Cosine |
Tangent |
Sum of angles |
1X |
|
|
|
|
|
|
|
|
|
|
2X |
|
|
|
|
|
|
|
|
|
|
3X |
|
|
|
|
|
|
|
|
|
|
4X |
|
|
|
|
|
|
|
|
|
|
5X |
|
|
|
|
|
|
|
|
|
|
6X |
|
|
|
|
|
|
|
|
|
|
100X |
|
|
|
|
|
|
|
|
|
|
 This display presents the concepts of proportion and ratio, being used to do indirect measurement, with one quantity and its relative, constant comparative size is used to determine another. A stretchable picture of a little girl and her smaller dog is used to illustrate the concept of proportions. As the picture increases or decreases in size, both images increase or decrease proportionally, so as to maintain the same relative size, or ratio between their heights.


